
Mission & Vision – Electric Power Industry
The electric power industry is closely related to industrial development. The industry covers 3 distinct phases including electric power generation, transmission, distribution, and the sale of electric power. Electric power generation includes Hydroelectric power generation, fossil fuel electric power generation, nuclear electric power generation, solar electric power generation, wind electric power generation, geothermal electric power generation, biomass electric power generation, electric bulk power transmission and control, and electric power distribution.
Through a global network of international buyers, suppliers, and support, BizVibe helps build a preference for trade in electric power generation, transmission, and distribution; advocates for the use of electric power and goes into detail about the buying and selling process related to electric power generation, transmissions, and distribution. BizVibe also promotes the benefits of electric power through education and connects industry leaders through a robust membership program that encourages seamless international trade between global partners all through one platform. This fact sheet is for you if you are looking to buy or sell from the leading electric power companies in 2020 and are trying to figure out all the details and barriers to best assist you through this process by teaching everything you need to know about electric power generation, transmission, and distribution.
BizVibe is already helping dozens of buyers and sellers in the electric power industry connect. See how BizVibe can help you too.
Power Generation Industry Trends
Who produces the most electricity in the world? China and the United States account for three-quarters of the global electricity production rise in 2018. The majority of the growth in global electric power generation occurred in Asia at +6.1%. Due to high demand, China accounts for nearly 60% of the global growth in electric power generation as of 2020. In terms of electric power generation, India, Japan, South Korea, and Indonesia are behind only China in the global growth of electric power generation.
Electric power generation in the United States grew +3.6%, as weather conditions and stellar growth of the economy increased the consumption of electricity consumption. In Canada, electric power generation declined this year. The Middle East, Africa, and Russia — due to economic recovery — saw an increase in electric power generation. In Latin America, electric power generation remains stable due to increased demand and growth in Mexico and Brazil, but a decline in Venezuela.
In Europe, power generation remained stable despite growth in France and Turkey thanks to higher hydropower and renewable power production. France is gearing toward nuclear availability. Power generation declined in Germany, Italy, the UK, and Belgium. In Belgium, electric power generation declined due to significant nuclear unavailability. The UK saw a decline due to a mild winter — lower demand.
Electrical Industry Trends
- The consumption of primary energy grew at a rate of 2.9% last year. This number has doubled its 10-year average of 1.5% per year, and the fastest growth of primary energy consumption since 2010.
- Energy consumption growth was mainly driven by natural gas — which contributed to more than 40% of the increase.
- China, the US and India together accounted for more than two-thirds of the global increase in energy demand, with US consumption expanding at its fastest rate for 30 years.
Electric Power Industry Breakdown
Electricity Industry
- Electricity generation grew by an above-average 3.7%, driven mainly by China (which accounted for more than half of the growth), India and the US.
- Renewables accounted for a third of the net increase in power generation, followed closely by coal (31%) and then natural gas (25%).
- The share of renewables in power generation increased from 8.4% to 9.3%. Coal still accounted for the largest share of power generation at a whopping 38%.
Renewables, Hydro, and Nuclear Industry
- Renewable power grew by 14.5%, slightly below its historical average, although its increase in energy terms of 71 Mtoe — millions of tonnes of oil equivalent — was close to the record-breaking increase of 2017.
- Solar generation grew by 30 Mtoe, right below the increase in wind (32 Mtoe) and provided more than 40% of renewables growth.
- By country, China was again the largest contributor to renewables growth (32 Mtoe), surpassing growth in the entire OECD (26 Mtoe).
- Hydroelectric generation increased by an above-average 3.1%, with European generation rebounding by 9.8% (12.9 Mtoe), almost offsetting its steep decline in the previous year.
- Nuclear generation rose by 2.4%, its fastest growth since 2010. China (10 Mtoe) contributed almost three-quarters of global growth, with Japan (5 Mtoe) the second-largest increase.
Natural Gas Industry
- Natural gas consumption grew by 195 billion cubic metres (bcm).
- Growth in gas consumption was driven mainly by the US at 78 bcm, followed by China (43 bcm), Russia (23 bcm) and Iran (16 bcm).
- Global natural gas production increased by 190 bcm, or 5.2%. Almost half of this came from the US (86 bcm), which (as with oil production) recorded the largest annual growth seen by any country in history. Russia (34 bcm), Iran (19 bcm) and Australia (17 bcm) were the next largest contributions to growth.
Electric Power Distribution and Trade: What You Need to Know
In the electric power industry, a system enables purchases, through bids to buy and sell. Bids and offers use the principles of supply and demand to set the price. Long-term trades are contracts similar to power purchase agreements and generally considered private bi-lateral transactions between counterparties.
Contrary to traditional capital markets, energy markets are much more fragmented. The intraday and real-time markets are managed and operated by Independent System Operators (ISO). These non-profit entities are organized on a physical grid arrangement commonly referred to as network topology. There are currently seven ISOs in the United States. ISOs act as market operators, performing tasks like power plant dispatch and real-time power balance operations. They also act as exchanges and clearinghouses for trading activities on different electricity markets.
Electric Power Prices
In the electric power industry, prices are set at the margin level, so the price is set as the next unit that is to be produced or based on the time it would take for the next person to drive to their destination. You would get paid that “time” regardless of how long it took you to get to your destination.
Which Country Pays the Most for Electricity? The Pacific island nation of Solomon Islands has the highest electricity cost in the world, at a staggering 99 US cents per kilowatt hour. The other countries with high energy prices are primarily tropical islands like Vanuatu, the US Virgin Islands, the Cook Islands, and Tonga. Some European countries such as Germany, Denmark, and Belgium also experience high electricity costs
Cost of Electricity by Country
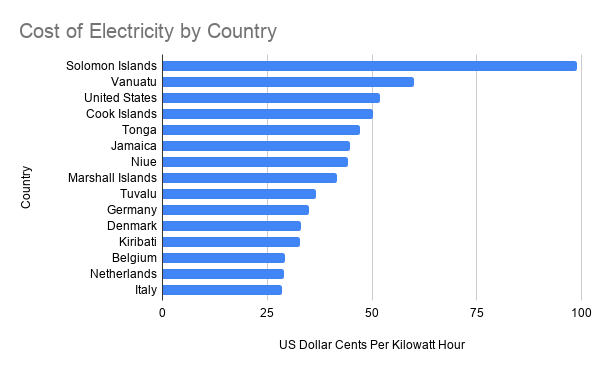
Source: World Atlas
Energy Exports by Country – Where You Should Be Trading
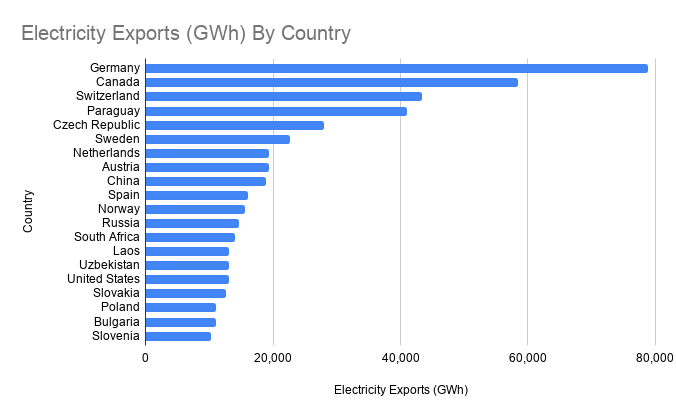
Source: The World Factbook
- Germany, Canada, Switzerland, Paraguay, and the Czech Republic exports the most electricity in the world.
Using BizVibe you can connect with these exporters and figure out how to trade with them.
International sales revenue from electricity exports by country totaled US$34.2 billion in 2018. The value of exported electrical energy increased by an average of 4% for all exporting countries since 2014 when electricity shipments were valued at $32.9 billion. Year over year exported electricity appreciated by 13.8% from 2017 to 2018.
Electricity Exports by Global Regions
- Europe sold the highest dollar amount of exported electricity with shipments valued at $23.5 billion — more than 68% of the global total.
- Asian exported 11.7% of electricity in 2018
- North America exported 8.4% of electricity in 2018.
- Smaller percentages came from electricity suppliers in Latin America (7.2%) excluding Mexico but including the Caribbean, and Africa (4.2%).
Where you should be trading – List of countries by electricity imports
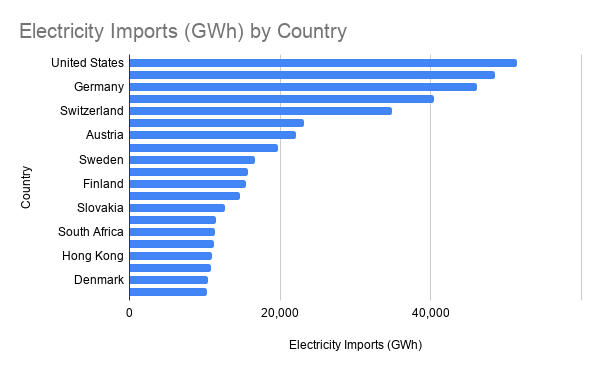
Source: The World Factbook
- The United States, Italy, Germany, Brazil, and Switzerland imports the most electricity in the world.
.
Facts About Electricity Imports and Exports
- Switzerland and Canada rank in the top 10 for imports and exports of electricity, making them ideal trading partners to target for B2B trade.
- 67% of Canada’s electricity comes from renewable sources and 82% from non-GHG emitting sources
- Canada is the world’s second-largest producer of hydroelectricity
- Canada exports nearly 9% of the electricity it generates to the United States. There are 34 active major international transmission lines connecting Canada to the U.S.
Largest Trading Partners – Electricity Distribution Worldwide
The United States & Canada
Electricity trading between the USA and Canada is on the rise, providing increased economic and reliability benefits to both nations. Despite the amount of electricity imported over the Canadian border being a smaller figure in terms of overall power supply in the US, the transmission connections linking Canada and the United States are an important component of the electricity markets in northern states.
Canada is a net exporter of electricity to the United States, and most of its power needs are met by hydroelectricity. Large hydroelectric projects in British Columbia, Manitoba, Quebec, and Newfoundland and Labrador have significantly increased the country’s generation capacity. In term of regions, Canada exports electricity mainly to New England, New York, and the Midwest states, while the United States exports electricity primarily from the Pacific Northwest states to the Canadian province of British Columbia.
There are more than 30 power transmission linkages between the United States and Canada. Recently, 60 power companies in Canada exported 58.4 terawatt hours (TWh) of electricity into the United States, making up 1.6% of US electricity retail sales and 10% of Canadian electricity generation. The largest exporters were Hydro-Québec (16.4 TWh) and the Manitoba Hydro-Electric Board (8.6 TWh).
Switzerland & Denmark
Switzerland is a popular hub for power trading, especially for French nuclear electricity, which passes from both France and Germany on to Italy.
Denmark is a hub for power trading between northern Scandinavia and the continent, Germany in particular. In fact, according to the Nordic Market Report, the interconnectors used the most was between Germany and Denmark; those lines ran at 77.1 percent of maximum capacity on average.
Scandinavia primarily benefits from surges in Danish wind power, which lower prices for everyone – and, of course, Norway has the potential to become northern Europe’s battery thanks to its tremendous hydropower capacity. The important thing to remember though is that these interconnections were not built for wind power; as Denmark’s Energy Agency puts it, Denmark has historically been a power trading hub.
Denmark and Switzerland are both small countries flooded with foreign electricity. Renewables need such power trading when they reach the level of wind power in Denmark. But this power trading did not come about to suit renewable energy. It has always been there in Switzerland, which has historically had very large shares of nuclear and hydropower – roughly 95 percent in 2014.
US Biomass Power Electric Generation
- Wood—mostly as pulp, paper, and paperboard industry waste products—accounts for 46% of total biomass energy consumption. Waste—municipal solid waste, landfill gas, sludge, tires, and agricultural by-products—accounts for an additional 10%.1
- Biomass has low net CO2 emissions compared to fossil fuels. At combustion, it releases CO2 previously removed from the atmosphere. Additional emissions are associated with processing and 124 acres of land are required to generate one GWh of electricity per year.19
- US ethanol production is projected to reach 40 million gallons per day in 2050.
Future Trends in Power Generation and Distribution
Expect future trends in power generation to gear more towards sustainable practices such as renewable energy, solar, and wind. As long as socities continue to develop the demand for power generation in the electric power industry is going nowhere. It’s import for businesses to get in touch with the companies that will help them buy & sell from leading electric power companies.