US soybean production continues to lead the world in 2020, making America one of the leading preferential global trading partner soybeans in the world. Soybeans are among the major agricultural crops planted in the United States, behind only corn. Soybeans belong to the oilseed crops category and most American soybeans are planted in May and early June and are generally harvested in September and October. Soybean farmers in the US generally grow soybeans in crop rotation, along with corn. Where are US soybeans grown?
More than 80 percent of soybeans are cultivated in the upper Midwest. Illinois, Iowa, and Minnesota are the leading soybean producing states.
Through a global network of international buyers, suppliers, and support in the US, BizVibe helps build a preference for soybeans from the United States of America; advocates for the use of soy in feed, aquaculture, and human consumption; promotes the benefits of soy use through education and connects industry leaders through a robust membership program and encourages seamless international trade between global partners — all through one platform. This guide is for you if you are looking to buy or sell US soybean products in 2020 and are trying to figure out all the details and barriers to best assist you through this process by teaching everything you need to know about US soybean production, exports, imports, prices and general trends moving forward to help enable seamless trade.
BizVibe is already helping dozens of buyers and sellers of US soybeans connect. See how BizVibe can help you too.
Key Metrics About US Soybean Production, Exports & Prices
Who produces the most soybeans in the world? As of 2020, The USA produces the 2nd most soybeans in the world followed only by Brazil. The world is projected to produce 337.7 million metric tons of soybeans, up 226K metric tons from last month. According to the USDA, the USA produced 96,841,000 metric tons of soybeans in January.
In the US, soybeans are the dominant oilseed, and account for 90 percent of the nation’s oilseed production, according to USDA. Oilseed is part of an agricultural commodity class that also includes canola, rapeseed, sunflower, and flax seeds.
- The USA accounts for 34 percent of the world’s soybean production.
- According to Commodity Basis, at 42 percent market share, The USA is also the largest exporter of raw soybeans in the world. In the United States, 34.4 million hectares of planting area is devoted to US soybeans.
- Minnesota, Kentucky, Ohio, Pennsylvania, and Wisconsin have the largest soybean plantations by average size.
- Illinois, Iowa, Indiana, Minnesota, and Nebraska are the states that produce the largest soybean yields.
- US soybean prices in the US are determined by increased bio-diesel demand, where the soy oil is used to fuel combustion engines, unlike other soybean-producing countries
- Planting of soybeans in the USA starts in May or early June, and harvesting commences in late September to October
- The annual production of soybean over the past 5 seasons was 3.55 billion bushels in 2019, 4.43 in 2018, 4.41 in 2017, 4.30 in 2016, and 3.93 billion bushes in 2015.
Annual US Soybean Production (1999 – 2019)
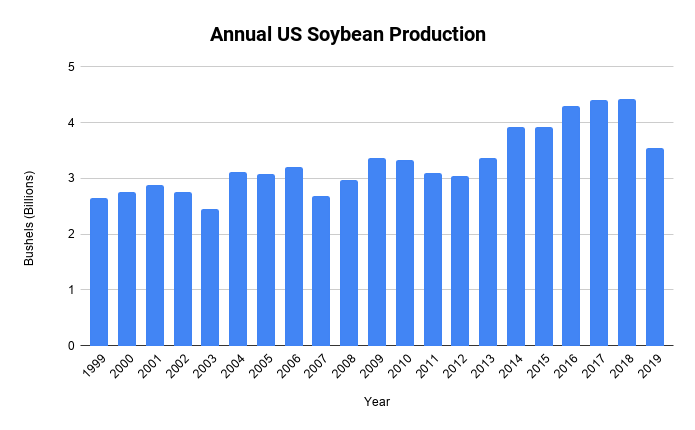
Source: USDA
US Soybean Production by State — 10 States That Produce the Most Soybeans
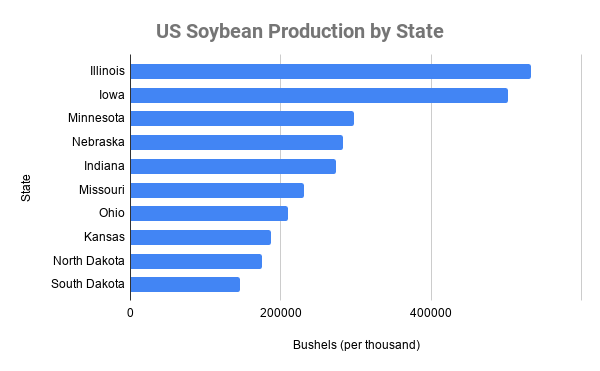
Iowa is the number two soybean producer in the country after Illinois. In 2019, Iowa produced 565 million bushels of soybeans, which compromises about 12.4 percent of US soybean production.
Source: Statista
US Soybeans Exports — Largest Trading Partners
- The United States exported 46.7 million metric tons of soybeans in 2019, up 10.8% from last year.
- The United States has exported the most soybeans so far in 2019 to China followed by the EU-28 and Mexico.
- The US soybean exports to China were up 144% in 2019.
US Soybean Exports to China
Historically, the bulk of American soybean sales to China is realized during the first quarter of the marketing year and through the second quarter, following the U.S. harvest and before Brazil’s soybean harvest is in full swing. Brazil has become the number one soybean supplier in China.
Historically, a good chunk of US soybean exports to China occurs during the first quarter and second quarter of the marketing year. American soybean sales to China are usually realized in this period because it follows the US harvest of soybeans and it’s right before Brazil’s soybean harvest. These are the times when trade is at its peak and the recommended period you should be buying and selling US soybeans.
Due to tariffs and an emphasis on Chinese imports of Brazilian soybeans, exports to China have been up and down in 2019. From January to February, in 2019, the USA exported 52.5 million bushels to China; followed-up by a second large purchase of 50.8 million bushels during the following week, both occurring after December 2018 trade talks between the U.S. and China.
US Soybean Exports & Prices to the Rest of the World
In 2018, from September to December, weekly US soybean exports outside of China averaged 36 million bushels — up 87 percent from the same period in 2017.
Why is the demand for US soybeans high? Due to large price discounts relative to Brazilian and Argentina’s soybeans, the demand for US soybeans continues to rise in markets that aren’t China. The trade dispute between the United States and China created a large surplus of American soybeans. Based on data from the USDA in 2018, the average US soybean export price was $327 per metric ton (MT), representing a discount of $61 per MT relative to Brazil’s average.
US Soybean Price Monthly
US soybean prices continue to be competitive for trade worldwide.
Source: indexmundi.com
Best Time to Sell US Soybeans
- April and May are the best time to sell corn.
- Yearly price lows occur during this July to October period.
- Lowest prices of the year most often occur during the June-October period, making it the worst average time to sell beans.
Commodity prices tend to follow predictable patterns each year based on the growing season along with supply and demand trends. Seasonal patterns don’t do a very good job of predicting when the highest price will occur. However, they do offer good suggestions on when prices are likely to be above or below average. Most yearly price lows occur during this July to October period
According to Iowa State University studies, pre-harvest spring sales tend to generate the highest returns.
Customer Segments – Who buys the Most US Soybeans
China
The USDA confirmed private sales to China of 68,000 tonnes of soybeans already for the 2019/20 marketing year. This was the first new soybean purchase by China since June. China remains the largest buyer of US soybeans in the world.
The Greater Europe Region
The Greater Europe Region Is a key market for US soybean exports for both whole soybeans and soybean meal. Why is the Greater European Region vital to US soybean sales? It’s a huge market that you can’t ignore, with a population of 850 million people, the region represents 27 percent of the world’s GDP.
Europe represents 11 percent of U.S. soybean and soybean meal exports at 6,500,00 MT (238 million bushels). The 10 countries of Germany, Spain, France, the Netherlands, Italy, the United Kingdom, Denmark, Portugal, Turkey and Russia import over 150,000 MT of US soybeans. The market for US soybean meal is growing due to demand from Europe. Other factors impacting growth are competitive US soybean prices and the reliability of export shipments.
Mexico
Mexico as a nation is the 2nd largest US soybean export market. From zero in the early 1980s, Mexican soybean purchases have grown exponentially, passing 152 million bushels. Mexico is extremely important to U.S. producers because it’s next door.
Mexican soybean imports over the coming decade should grow by 20+%, according to USDA’s Economic Research Service. It forecasts strong growth in imports of protein feed and vegetable oils, including soybean meal and oil.
Egypt
Egypt is the fastest growing market for US soybeans, importing over 2.64 million metric tons of American soybeans this year, providing feed for fast-growing local poultry, aquaculture/fish, and dairy industries. Most of those soybeans will be imported and, as it stands now, most will likely come from the U.S. Egypt imported a total of 3.43 million metric tons of soybeans in the calendar year 2018 and about 3 million of those tons, or 87%, came from U.S. farms, according to FAS data.
Indonesia
Due to the demand for full flat soybeans in the feed industry, The US has been able to export a large number of soybeans to Indonesia. USDA expects that this trend will continue into the next marketing year with the agency’s official July projection of 2.95 million tonnes.
Thailand
Thailand imports nearly 3 million metric tons (110 million bushels) of soybeans each year and another 2.5 million metric tons of soybean meal.
Taiwan
Foods made from soy (soy foods) are a staple of the Taiwanese diet and the market relies heavily on the United States to supply it with oils for cooking or soybean meal to meet the country’s pork and poultry production needs. Back in 1969, Taiwan imported just 472,000 metric tons of soybeans from the United States. By the most recent marketing year, however, U.S. exports to Taiwan exceeded 2.2 million metric tons, an 86% market share. Taiwan also serves as a strategic market for U.S. Soy, ranking seventh for soybean exports.
Pakistan
In the current 2018 marketing year, Pakistan has bought 1.72 million metric tons (MMT) of U.S soybeans so far, compared to just 630 thousand metric tons (TMT) in the entire 2017 marketing year.
A few years ago, Pakistan’s imports of U.S. soybeans were insignificant — with numbers near zero.
South Korea
A free trade agreement put in place between the United States and Korea back in 2012 has led to a boost in U.S. grain imports by South Korea. Brazil accounted for 50% of all soybean imports into South Korea in 2017/18 followed by the U.S. at 45%.
Due to a free trade agreement between the USA and South Korea back in 2012, US grain exports to South Korea have grown enormously. Brazil accounts for 50% of all soybean imports into South Korea, followed by the United States at 45%.
The Future of US Soybean Exports, Imports, Production & Prices
The future of the US soybeans industry continues to look promising. Despite tariffs and regulations that sometimes affect trade, the demand for US soybeans looks promising as US soybean export shipments continue to be reliable and prices continue to remain competitive.